
A few months back, while working on a backend service that used Drools for rule evaluation, I noticed something odd - JVM heap usage kept climbing, GC metrics were off, and eventually, the service crashed with an OutOfMemoryError. Profiling the JVM with VisualVM and Java Flight Recorder, and analyzing a heap dump revealed a memory leak tied to rule engine objects.
The root cause? A Drool’s Session resource that wasn’t closed properly. That one oversight let to retained references, bloated heap and a production outage.
In this post, I’ll walk through how I diagnosed the issue, the tools I used, and the fix that restored heap sanity. If you’re looking for a JVM memory leak debugging – this one’s for you.
When the Heap started groaning
Before diving into heap dumps and leak analysis, it’s worth looking at how the problem surfaced - through JVM metrics and container behavior in production.
Monitoring Setup: JVM in Fargate
This Java service was deployed on AWS Fargate, running containerized workloads with no direct shell access. To monitor JVM health:
- Datadog was used to track JVM metrics like heap usage, GC activity, thread counts, and latency.
Enable JMXFetch and use Datadog Java Agent to collect run-time metrics.
- Heap dumps were configured and written to Amazon S3 for offline analysis.
Enable
—XX:+HeapDumpOnOutOfMemoryErrorflag and modify the Dockerfile to use AWS CLI to write the.hproffile to S3 bucket.
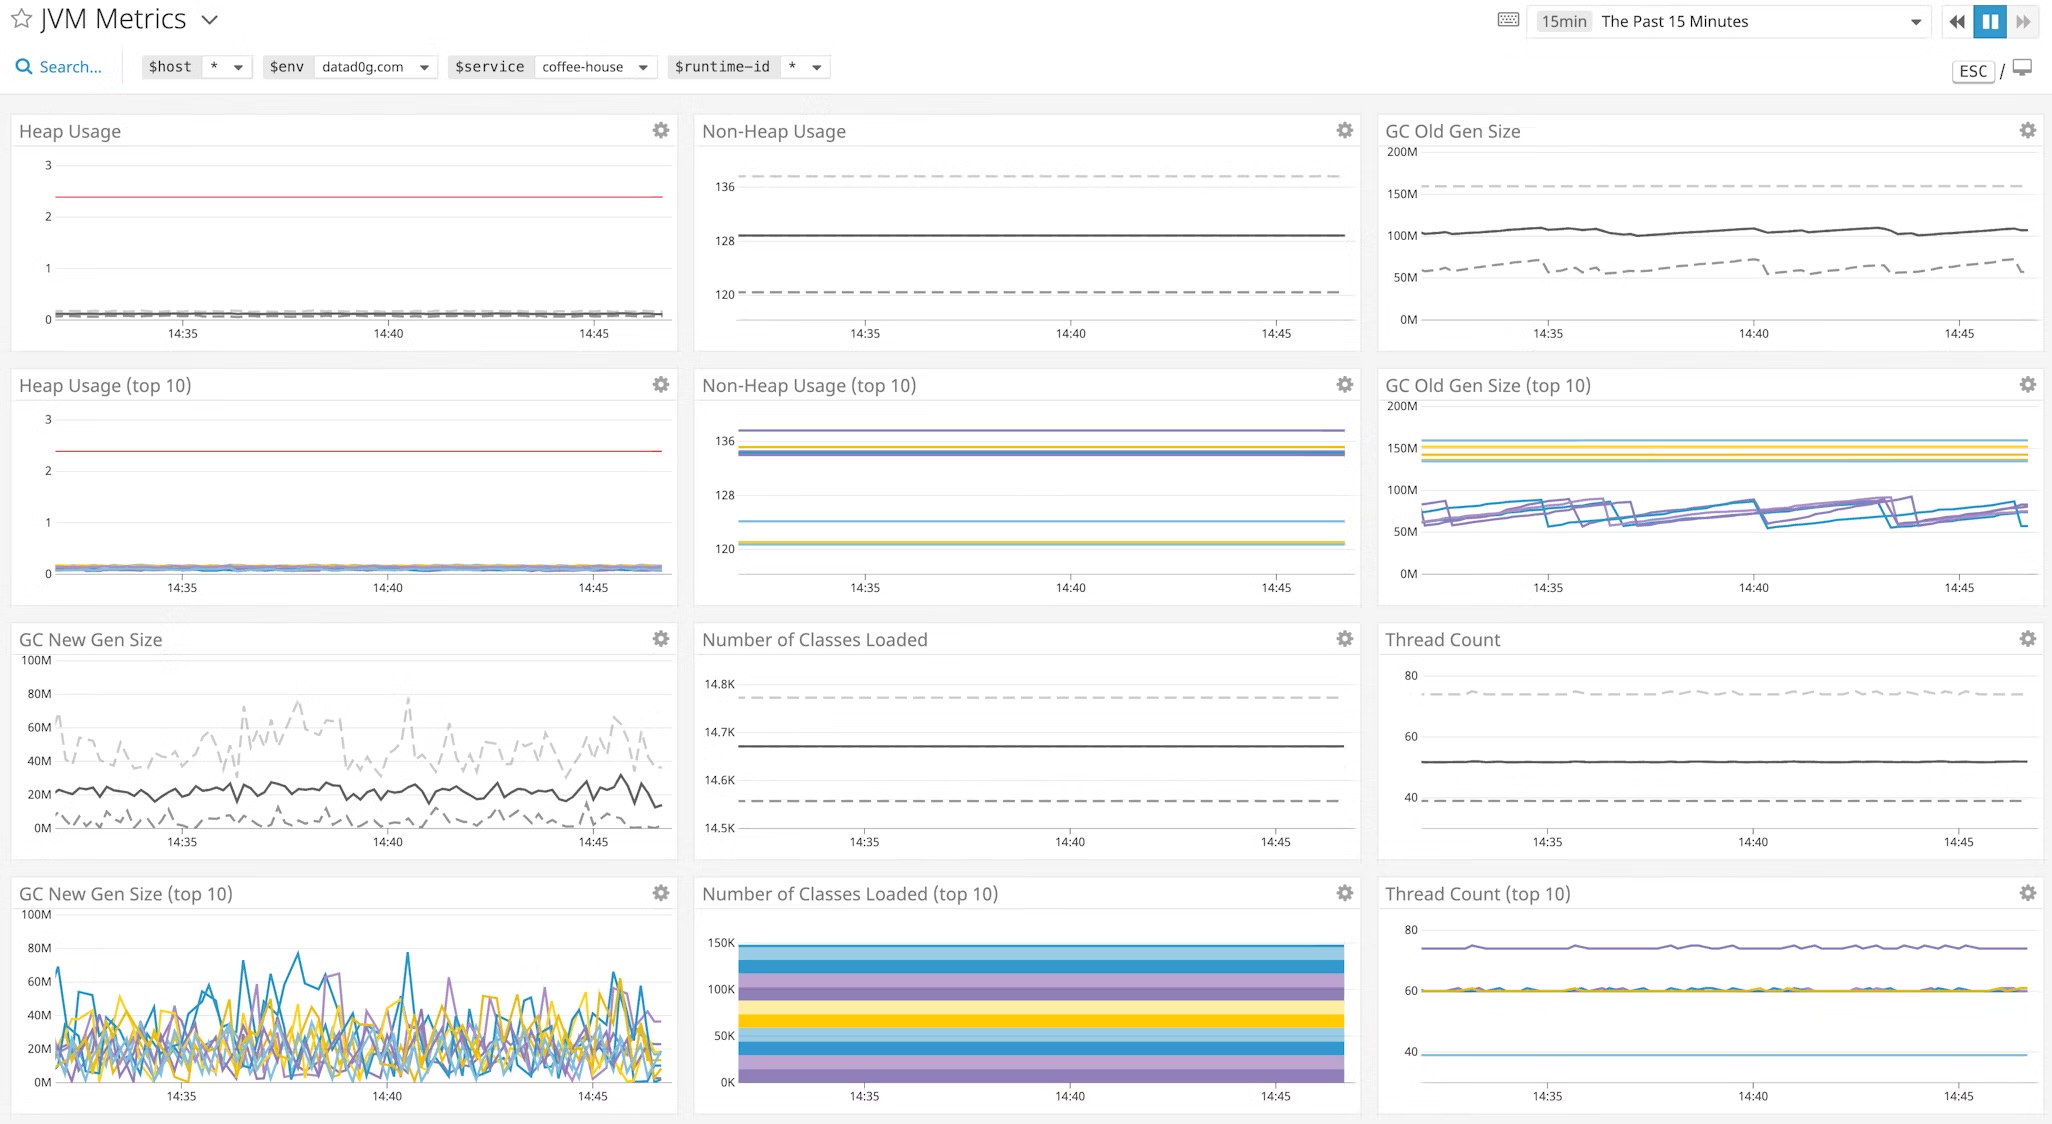
JVM Metric Trends: The Climb Begins
The first sign of trouble appeared in the dashboards:
- Heap Usage - Gradually increased over time, even during low traffic.
- GC Frequency - Minor GCs became frequent, followed by full GCs that reclaimed very little memory and a spike in GS Pause Time.
- Full GCs: Became increasingly frequent - a strong indicator that the JVM was struggling to reclaim space. In healthy applications, full GCs should be rare and efficient.
Debugging: Tracing the Leak
Once the Fargate container crashed with OOM, JVM wrote the heap dump directly to Amazon S3, thanks to —XX:+HeapDumpOnOutOfMemoryError flag and custom container logic. This gave me a snapshot of the JVM’s memory state at the moment of failure — perfect for post-mortem analysis.
Tools Used
- Intellij IDEA Profiler Tool Window: Loaded the .hrpof file to inspect retained objects and reference chains.
- VisualVM and JFR: Used for live profiling in local machines.
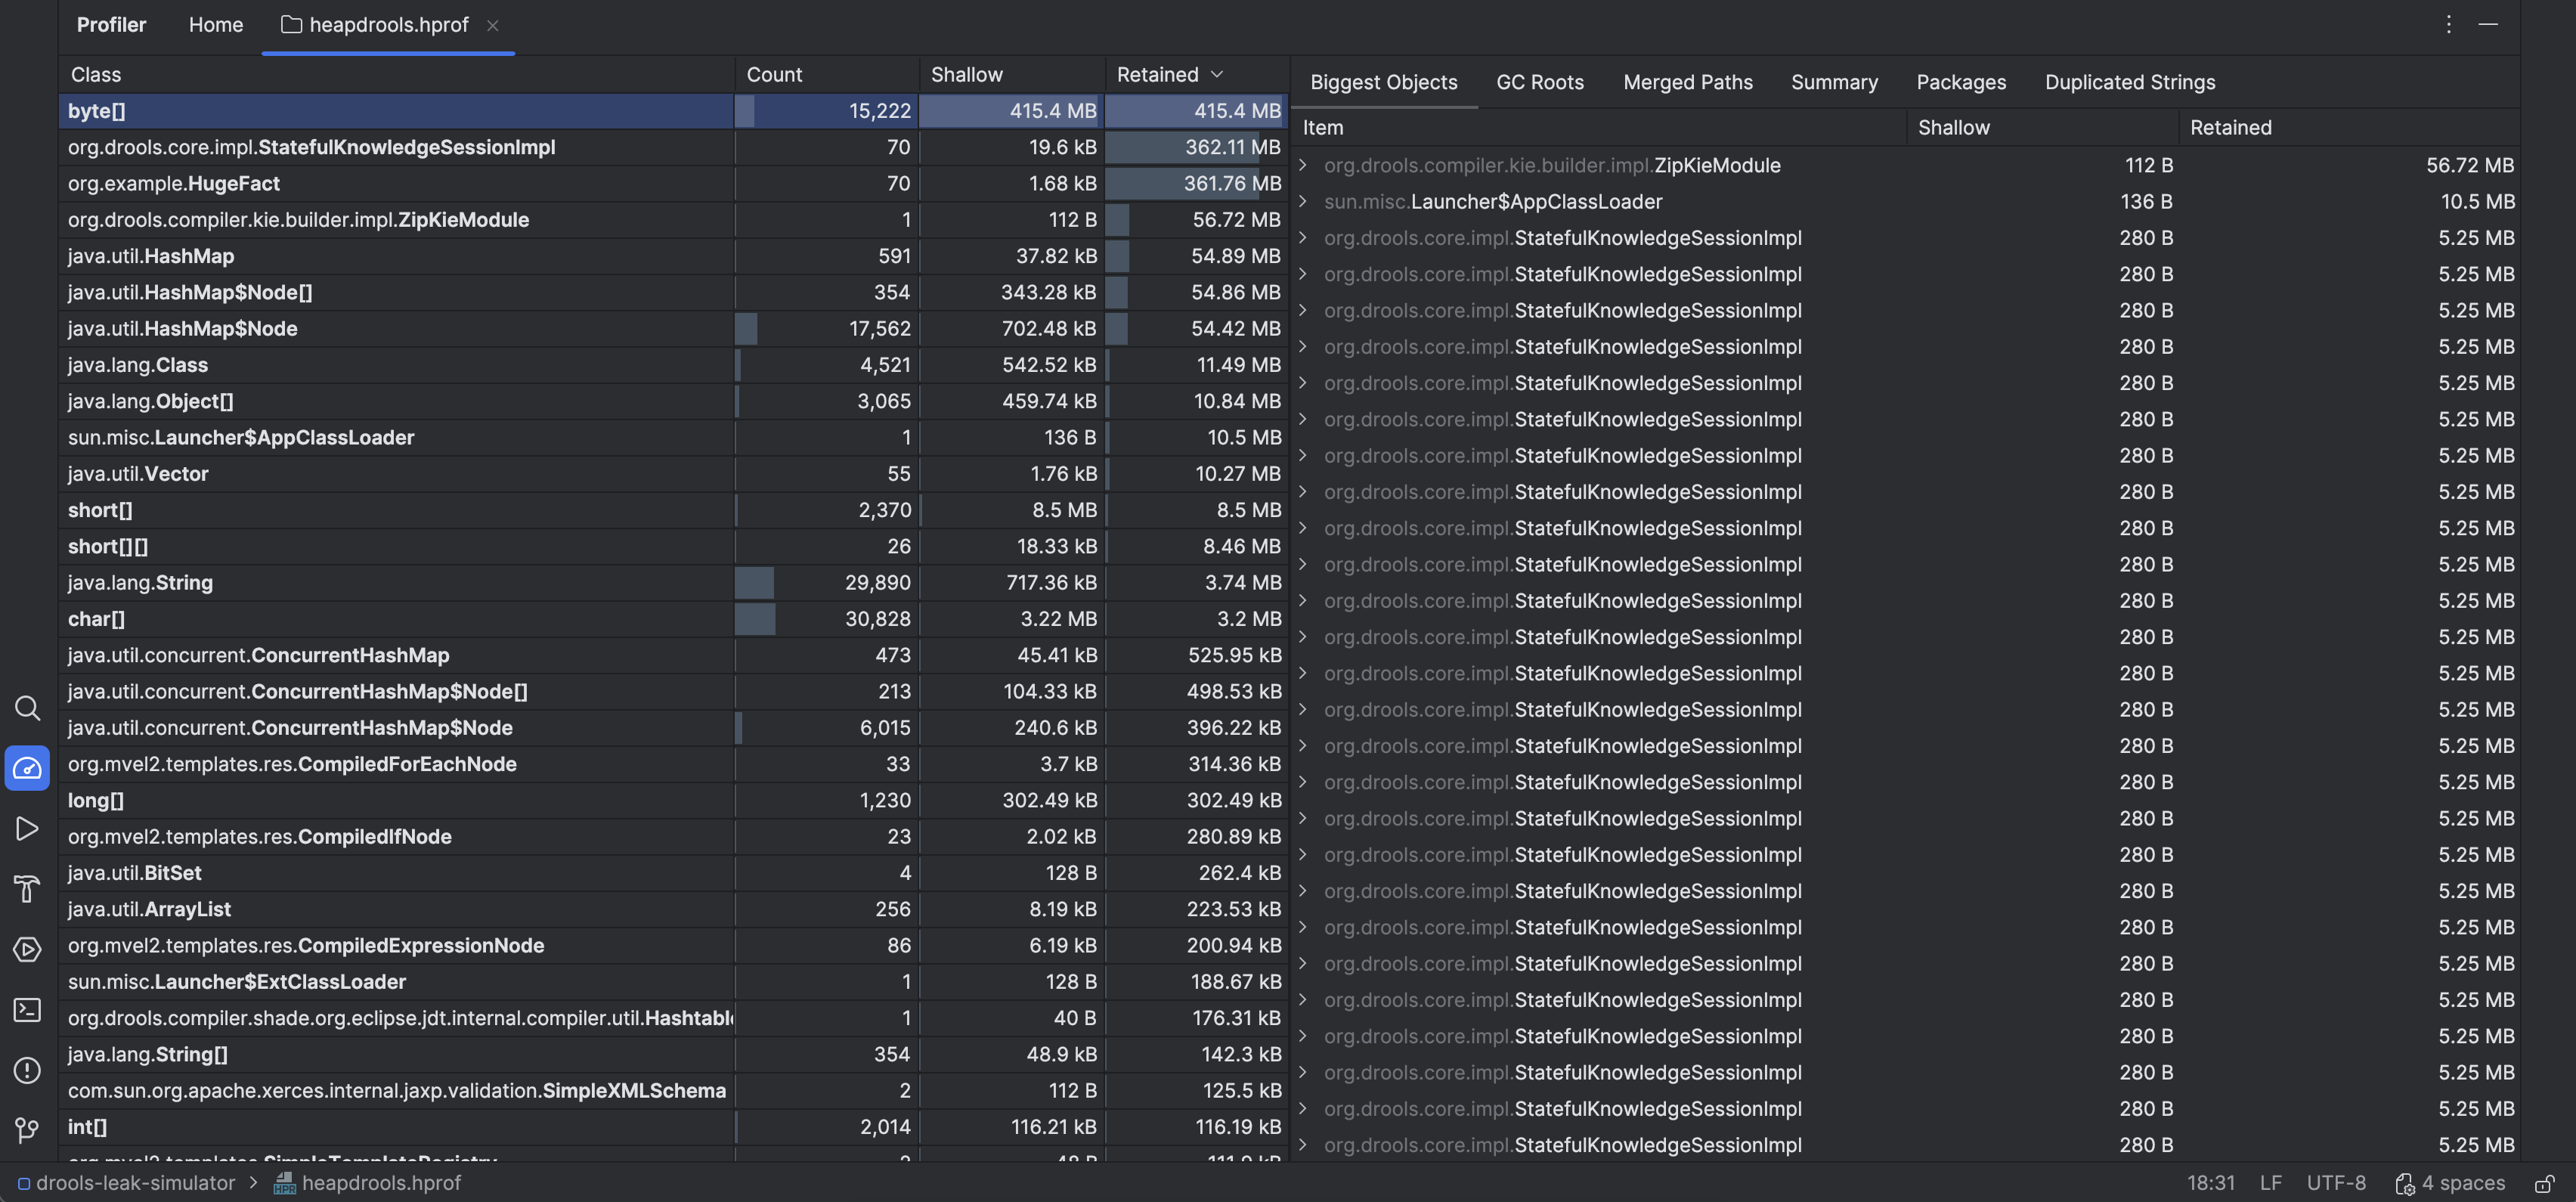
What the Heap Dump Revealed
- A large number of retained objects were linked to Drools internals - specifically the working memory. These were large objects too, considering the fact that a lot of payment records were fetched to run the rule.
- Profiler window flagged a
KnowledgeBaseImplandStatefulKnowlegeSessionImplinstance with a high retained size (KieSessioninternals).
The Fix
Above analysis confirmed that an KieSession was anchoring working memory and preventing garbage collection. The fix was straightforward:
	KieSession session = kieContainer.newKieSession();
	try {
		session.insert(fact);
		session.fireRule();
		...
	} finally {
		session.dispose(); // THE FIX!!!
	}
A better solution:
	// Using try-with-resources
	try(KieSession session = kieContainer.newKieSession()) {
		session.insert(fact);
		session.fireRule();
		...
	}
Lessons Learned
This wasn’t just a memory leak — it was a reminder that good coding practices are your first line of defence. The root cause wasn’t exotic or obscure. It was a missing close-the-resource call. One line. One habit. One oversight.
Even with solid coding habits, bugs slip through. But when they do, we’re equipped — with the right tools, clear steps, and a proven path to trace, diagnose, and fix the issue before it spirals.